“`html
How to Effectively Find the Slope of a Graph
Understanding how to find the slope of a graph is a fundamental skill in mathematics, particularly in coordinate geometry. This knowledge not only applies to linear equations but is also critical in many practical real-world applications. Whether you’re working with a linear function or analyzing rates of change, mastering the concepts of **slope**, including the **rise over run** technique, will enhance your mathematical abilities in 2025 and beyond.
Understanding Slope and its Importance
**Slope** is a measure of steepness and can be expressed mathematically through the **slope formula**. It essentially quantifies the vertical change (rise) relative to the horizontal change (run) between two points on a graph. The slope is crucial not just in algebra but also in **calculus**, physics, and real-life applications, such as understanding the steepness of hills or the **rate of change** in different contexts. Recognizing the slope properties, including **positive**, **negative**, **zero**, and **undefined slopes**, can significantly improve your graph interpretation skills and visual slope representation.
The Basic Definition of Slope
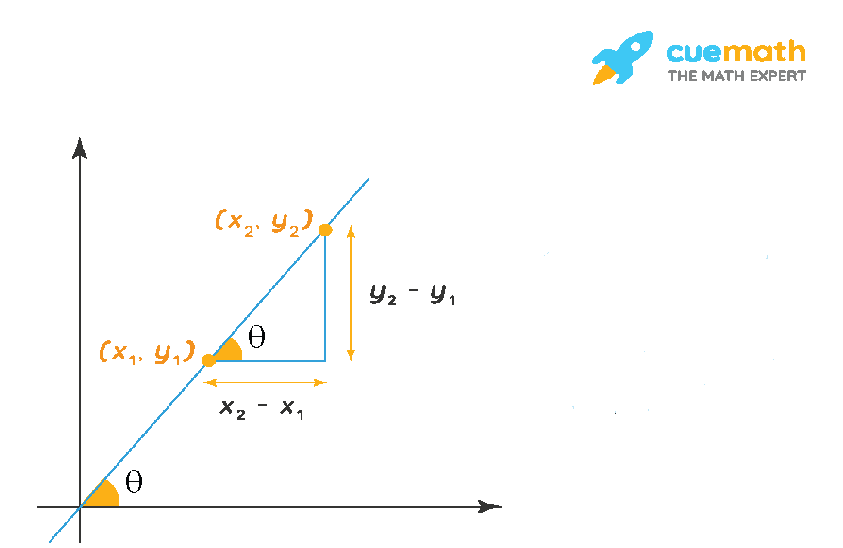
The definition of **slope** can be succinctly summarized as the ratio of the vertical change to the horizontal change between two points on a line. Mathematically, it’s defined as:
Slope (m) = (y2 – y1) / (x2 – x1). Here, (x1, y1) and (x2, y2) are the coordinates of two different points on the graph. The concept of **rate of change** is encapsulated within this definition, as it provides insight into how one variable changes relative to another. If you understand how to read graphs and determine slope accurately, you can apply this knowledge to predict outcomes in numerous fields.
Types of Slopes in Graphs
Slopes can be categorized into several types that have different interpretations:
- Positive Slope: Indicates that as the value of x increases, the value of y also increases, revealing a trend of growth.
- Negative Slope: Shows that an increase in x results in a decrease in y, indicating a downward trend.
- Zero Slope: Occurs when a line is horizontal, meaning there is no vertical change as x changes.
- Undefined Slope: Occurs with vertical lines where x remains constant regardless of y.
Understanding these types can significantly assist in grasping concepts in linear functions and improve graphical analysis.
Techniques to Calculate Slope
To **calculate slope** effectively, there are several methods you can utilize. Each technique is suitable for different scenarios and provides insights into various aspects of a graph. Being proficient in these methods will undoubtedly advance your analytical capabilities.
Using the Slope Formula
The most straightforward method to find the slope is by using the **slope formula**, which involves substituting the coordinates of two points. Imagine you have two points on a graph: Point A (2, 3) and Point B (5, 11). Plugging these values into the slope formula gives:
m = (11 – 3) / (5 – 2) = 8 / 3. Therefore, the slope of the line passing through these points is **8/3**, indicating a steep increase in value as you move along the x-axis.
Graphical Interpretation of Slope
A graphical analysis of slope adds an intuitive element to your understanding. By sketching a graph and visualizing the **rise over run**, you can see how steep the line is. For instance, if the line ascends steeply from left to right, it suggests a steep positive slope. Conversely, a line that descends gently suggests a minimal negative slope. This method is particularly useful in **analyzing angles** of graphs and understanding the graphical representation of slope attributes.
Using Slope in Real Life and Various Fields
Once you’ve mastered the techniques to calculate slope, you can apply this knowledge practically across various fields. From physics to economics, the concepts of slope find applications in numerous areas that require the analysis of change. Understanding how to interpret and apply slopes is invaluable in your academic journey.
Slope Applications in Physics
In physics, slope represents velocity in a distance-time graph. A steeper slope indicates greater speed, while a shallower slope indicates slower speed. Understanding how to interpret slope can help you analyze motion and predict how objects behave under different conditions. For instance, if a cyclist travels faster as they climb a hill, the slope of the graph on their speed-time chart will indicate that acceleration is taking place.
Slope in Engineering and Design
Engineers often use slope calculations to ensure safety and efficiency in designs. For instance, in road design, the slope of the road affects drainage, speed, and vehicle dynamics. By applying **slope theories** in practice, engineers can predict potential issues such as skidding or falling vegetation. Abiding by standards like rise/run ratios is essential in making effective designs that enhance usability and safety.
Key Takeaways
- Understanding slope as a measure of steepness allows better graph interpretation.
- Mastering the slope formula enhances your ability to analyze change accurately.
- Recognizing different types of slopes broadens your understanding of linear functions.
FAQ
1. How do you calculate slope using coordinate geometry?
To calculate slope using coordinate geometry, apply the slope formula: m = (y2 – y1) / (x2 – x1). Choose two points with known coordinates and plug the values into the formula to find the slope between those points.
2. What does a positive slope indicate in graph analysis?
A positive slope indicates an increasing trend; as the x-values increase, the y-values also increase, denoting a growth relationship between the variables represented on the graph.
3. Can you explain what an undefined slope represents?
An undefined slope is found with vertical lines where x values remain constant regardless of the y-values. This indicates that there is no horizontal change, which leads to a failure in calculating the slope using regular methods.
4. How do slopes relate to real-world applications?
Slopes relate to real-world applications by helping quantify relationships between variables, such as speed in motion graphs and the steepness of ramps in architecture, enabling better designs and predictions.
5. What is the significance of slope in linear functions?
The significance of slope in linear functions lies in its ability to define the relationship between two variables, showing how one changes in response to another. It’s crucial for understanding trends and behaviors in data.


“`