Effective Ways to Calculate Cumulative Frequency in 2025
Understanding Cumulative Frequency
Cumulative frequency is an essential concept in statistics, particularly in data analysis. It represents the total number of observations accumulated up to a certain point in a data set. By understanding how to calculate cumulative frequency, one can better interpret the data, spot trends, and visualize distributions. It involves adding up the frequencies in a frequency distribution table to show how many observations fall below a particular value. This process is crucial for creating cumulative frequency tables, graphs, and polygons that aid in data interpretation and analysis.
Cumulative Frequency Definition
The **cumulative frequency definition** encapsulates the idea of increasing totals. For any dataset, the cumulative frequency at a point is the sum of all frequencies preceding that point. For instance, in teaching statistics, we might have a **cumulative frequency table** derived from test scores where each row sums up the results for all lower scores. This table serves as a basis for constructing graphs and conducting further analysis, such as assessing trends in performance over time or among different groups.
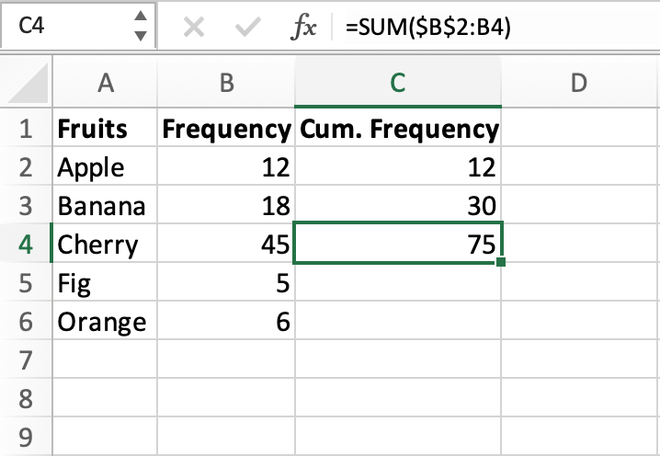
Calculating Cumulative Frequency
To **calculate cumulative frequency**, start with a **frequency distribution table**. List all values or intervals, then add their frequencies sequentially. For example, consider the scores in a test: if we have 5 students scoring 45, 10 achieving 50, and 15 with 55, our **cumulative frequency** for the score of 50 would be 5 (score 45) + 10 (score 50) = 15. Therefore, knowing how to find cumulative frequency lays the groundwork for more advanced statistical concepts.
Visualizing Cumulative Frequency
Creating a **cumulative frequency graph**, often called a cumulative frequency polygon, is an effective means of visualizing data. This graph represents accumulative totals and allows for easy identification of trends and potential outliers. To draw it, plot the cumulative frequency values against the data set. The resulting line can help to understand data distribution patterns quickly. For instance, in a recent study of test scores, educators utilized a cumulative frequency graph to visually assess student performance, making it easier to draw insights for future classes.
Cumulative Frequency in Data Analysis
Cumulative frequency analysis plays a pivotal role in interpreting large datasets in various fields, including education, economics, and healthcare. By analyzing cumulative frequency, statisticians can uncover insights about data trends, the distribution of significant events, and comparative performance indicators. Understanding how to apply cumulative frequency in statistics offers the opportunity to engage in deeper interpretations and efficient data representation.
Case Study: Using Cumulative Frequency in Education
An application example of **cumulative frequency** can be seen in educational assessments. In a study of student grades across several classes, educators gathered the scores and constructed a **cumulative frequency distribution table**. This process enabled them to identify how many students scored below certain benchmarks and allowed for targeted interventions for struggling students. For instance, a cumulative frequency analysis revealed that 40% of students scored below a passing grade, prompting the institution to implement new teaching strategies for improvement.
Cumulative Relative Frequency
Cumulative relative frequency is another layer to consider when diving into **cumulative frequency statistics**. It evaluates the proportion of total observations represented in the cumulative frequency. For example, if you have 100 students and a cumulative frequency of 30 for those who have passed a particular exam, the cumulative relative frequency would be 30%. This measure clarifies the cumulative data representation further by introducing a percentage basis, benefiting advanced statistical analysis and comparative studies.
Using Cumulative Frequency with Grouped Data
When dealing with large datasets, often data is aggregated into groups. Understanding **cumulative frequency for grouped data** is crucial for maintaining the integrity of the analysis. For example, if exam scores are grouped into ranges (e.g., 0-50, 51-75, 76-100), to calculate cumulative frequency, add the counts in each group cumulatively. By doing so, we enhance our overall understanding of how scores are distributed in relation to quantitative thresholds, which can significantly influence educational assessment methods and approaches to learning outcomes.
Creating Cumulative Frequency Tables and Graphs
For accurate and insightful analysis, constructing **cumulative frequency tables** and graphs is paramount. A well-structured table serves as a foundation for any statistical investigation, providing clear visibility on how data accumulates over defined intervals. This section will focus on practical steps for designing both tables and graphs to ensure maximum clarity and effectiveness.
Steps to Create a Cumulative Frequency Table
- Start by collecting and sorting your data in ascending order.
- Create a frequency distribution table to organize the data into defined categories.
- Begin calculating cumulative frequency by adding each category’s frequency to the total from preceding categories.
- Complete the table by reviewing the totals to ensure accuracy.
The **cumulative frequency table** should now reflect the accumulated counts, providing easy reference for further analyses like inferential statistics and hypothesis testing.
Constructing a Cumulative Frequency Graph
- Utilize your completed cumulative frequency table to plot the cumulative frequency against corresponding values or intervals.
- Label your axes appropriately—the x-axis for data values and the y-axis for cumulative frequency counts.
- Draw line connectors between points to create the cumulative frequency polygon.
This graphical representation provides not only a tangible visualization of the cumulative frequency but also helps identify peaks and troughs in the data, which can spark new questions and further investigations into the dataset.
Key Takeaways
- Cumulative frequency is vital for understanding data trends and distributions.
- Utilizing cumulative frequency tables enriches analytical processes in various fields.
- Creating visual representations, such as graphs and polygons, aids effective data communication.
- Knowledge of cumulative relative frequency adds depth to cumulative frequency analysis.
- Practical steps for table and graph creation drive clarity in data representation.
FAQ
1. What is a cumulative frequency distribution table?
A **cumulative frequency distribution table** sums the frequencies of different data sets to show the total number of occurrences up to various data points. It serves as a preparatory measure for constructing graphs and conducting deeper statistical analysis. Creating this table involves carefully adding up frequencies for each point of interest in the dataset.
2. How does cumulative frequency differ from regular frequency?
Cumulative frequency differs from **regular frequency** in that it accumulates the count of observations up to a given point, while regular frequency merely counts occurrences for each specific value or range. This key distinction allows cumulative frequency to provide insights about trends and overall distributions within statistical analysis.
3. Can you provide an example of cumulative frequency in statistics?
Certainly! For example, if in a test 5 students scored 45, 10 scored 50, and 15 scored 55, the cumulative frequency would be calculated as follows: at 50, it would be 5 + 10 = 15, and at 55, it would be 5 + 10 + 15 = 30. This cumulative frequency evaluation gives a rounded view of overall student performance and helps educators identify specific learning needs.
4. Why is cumulative frequency important in data visualization?
Cumulative frequency is essential in data visualization because it helps to represent how data aggregations occur across different ranges. By visualizing cumulative frequencies, analysts and stakeholders can recognize patterns, derive insights for future research, and make data-driven decisions regarding trends, performance, or operational adjustments.
5. What are some common problems encountered when calculating cumulative frequency?
Common problems when calculating cumulative frequency include miscalculating totals by overlooking groups, failing to follow the correct order of addition, or misunderstandings around the data’s distribution range. To resolve these, consistently double-check calculations and ensure clarity on data segmentation is maintained throughout the process.