Effective Ways to Calculate Degrees of Freedom in 2025
Understanding Degrees of Freedom
The concept of **degrees of freedom** is fundamental in statistical analysis, playing a crucial role in various calculations and interpretations. In essence, degrees of freedom refer to the number of independent values or quantities that can vary in statistical calculations. Understanding degrees of freedom is essential for anyone engaged in **statistical modeling**, whether it’s for academic research, clinical studies, or data analysis. The degrees of freedom formula varies depending on the context of the analysis, such as **t-tests**, ANOVA, or regression. A firm grasp on this concept not only aids in conducting more reliable tests but also lands a better interpretation of **statistical results**.
Degrees of Freedom in Hypothesis Testing
In hypothesis testing, degrees of freedom are utilized to assess the power of various statistical tests. The degrees of freedom applicable for a **t-test** is determined primarily by the number of samples and observations. For example, in an independent sample t-test, the formula for calculating degrees of freedom is \(df = n_1 + n_2 – 2\), where \(n_1\) and \(n_2\) represent the sample sizes of the two groups. Understanding degrees of freedom in this context helps statisticians determine critical values from the t-distribution, crucial for assessing the null hypothesis’s validity. By ensuring proper **degrees of freedom adjustments**, hypothesis testing becomes more robust and reliable.
Calculating Degrees of Freedom for ANOVA
In **ANOVA** (Analysis of Variance), degrees of freedom are critical for differentiating between the variability between groups and within groups. The degrees of freedom for between-group variance is calculated as \(k – 1\) (where \(k\) is the number of groups), while for within-group variance, it is calculated as \(N – k\) (where \(N\) is the total number of observations). Thus, the total degrees of freedom in ANOVA can be articulated as \(N – 1\). Recognizing how to calculate degrees of freedom in such analyses is vital for determining the F-statistic, which ultimately helps in making decisions regarding the null hypothesis.
Significance of Degrees of Freedom in Research
The importance of degrees of freedom in research cannot be understated. They play a pivotal role in assessing the accuracy and reliability of statistical tests. For instance, as sample sizes increase, degrees of freedom increase, enhancing the **statistical power**. Conversely, with smaller sample sizes, researchers might struggle with insufficient degrees of freedom, impacting the reliability of their findings. Various techniques such as **bootstrapping** can be used for optimizing degrees of freedom and overcoming limitations in smaller datasets. By effectively managing the degrees of freedom in research settings, scholars can achieve more robust results and provide valuable insights in their respective fields.
Calculating Sample Degrees of Freedom
In many statistical tests, particularly parametric tests, calculating **sample degrees of freedom** is fundamental. For instance, when assessing sample variance, degrees of freedom are calculated with the formula \(df = n – 1\), where \(n\) is the sample size. This adjustment accounts for the loss of one degree of freedom due to estimating the population mean from the sample data. An accurately calculated degrees of freedom is essential for constructing confidence intervals and accurately conducting further analyses, thus making it pivotal in **assessing sample variance**.
Degrees of Freedom in Simple Linear Regression
When it comes to **simple linear regression**, degrees of freedom play a crucial role in understanding the relationship between variables. For a regression model, the degrees of freedom are calculated as \(df = n – k\), where \(k\) refers to the number of parameters being estimated (including the intercept). This allowance ensures a fair representation of residuals within the model, making it crucial for satisfying assumptions inherent in regression analysis. Correct interpretation of degrees of freedom in this context can significantly affect the outcomes, providing insights into predictive modeling and fitting accuracy.
Degrees of Freedom Adjustments
In some scenarios, particularly advanced statistical methods like **regression analysis**, adjustments to degrees of freedom may be crucial for accurate calculations. This could involve using **restricted maximum likelihood estimation (REML)** or similar techniques that specify models involving complex sample design or incorporation of additional parameters. Properly managing the **degrees of freedom adjustments** allows researchers to address specific conditions pertinent to their analysis, returning better model evaluation and reliability of derived statistical properties. Such practices harness the true power of statistical methods, yielding insights that reflect an accurate understanding of the data.
Applications of Degrees of Freedom in Multivariate Analysis
Degrees of freedom hold immense value in **multivariate analysis** where multiple dependent variables are analyzed simultaneously. Here, the degrees of freedom are determined based on the number of variables and the sample size at hand. For example, in the context of **MANOVA** (Multivariate Analysis of Variance), understanding degrees of freedom helps in establishing relationship patterns between the variables involved. These insights allow for effective multi-dimensional data interpretation, leveraging multivariate analysis to achieve comprehensive analytical outcomes.
Degrees of Freedom for Complex Surveys
When dealing with complex surveys, particularly those incorporating stratified or cluster sampling, calculating degrees of freedom requires careful consideration. For instance, to accurately gauge the degrees of freedom, researchers may apply corrections due to the design effect, which influences the representativeness of the sample. Correctly accounting for these adjustments not only bolsters the reliability of interpretations but also positively impacts **statistical significance testing** within the context of the specific study. By comprehensively utilizing degrees of freedom in complex survey designs, researchers can achieve nuanced and meaningful results critical for supporting their hypotheses.
Degrees of Freedom Visualization Techniques
Understanding degrees of freedom can be challenging, but employing **visualization techniques** can simplify these complex concepts. Statistical software typically allows users to visualize degrees of freedom against other parameters, enhancing comprehension of the analytical landscapes. Graphs and charts can illustrate the relationship between sample sizes and degrees of freedom, as well as their implications on statistical significance, enhancing data interpretation. Effective visualization techniques assist not only in presentation but also in fostering a deeper understanding of the underlying data analysis processes.
Key Takeaways
- Degrees of freedom are vital for accurate statistical analysis across various contexts, including t-tests, ANOVA, and regression analysis.
- Understanding how to calculate degrees of freedom correctly can significantly impact the reliability of statistical outcomes.
- Adjustments in degrees of freedom are essential, particularly in complex statistical designs and analyses involving small sample sizes.
- Utilizing degrees of freedom in multivariate analyses offers deeper insights into relationships among multiple variables.
- Effective visualization of degrees of freedom can enhance understanding and facilitate better data interpretation.
FAQ
1. What is the main purpose of degrees of freedom in statistical tests?
The main purpose of degrees of freedom in statistical tests is to establish the number of independent pieces of information available for estimating parameters, calculating variance, and evaluating hypotheses. By accurately determining degrees of freedom, researchers can identify the appropriate **critical values** from statistical distributions, leading to reliable interpretations of data. Thus, understanding degrees of freedom enhances the accuracy of **significance tests**.
2. How do I calculate degrees of freedom for a chi-square test?
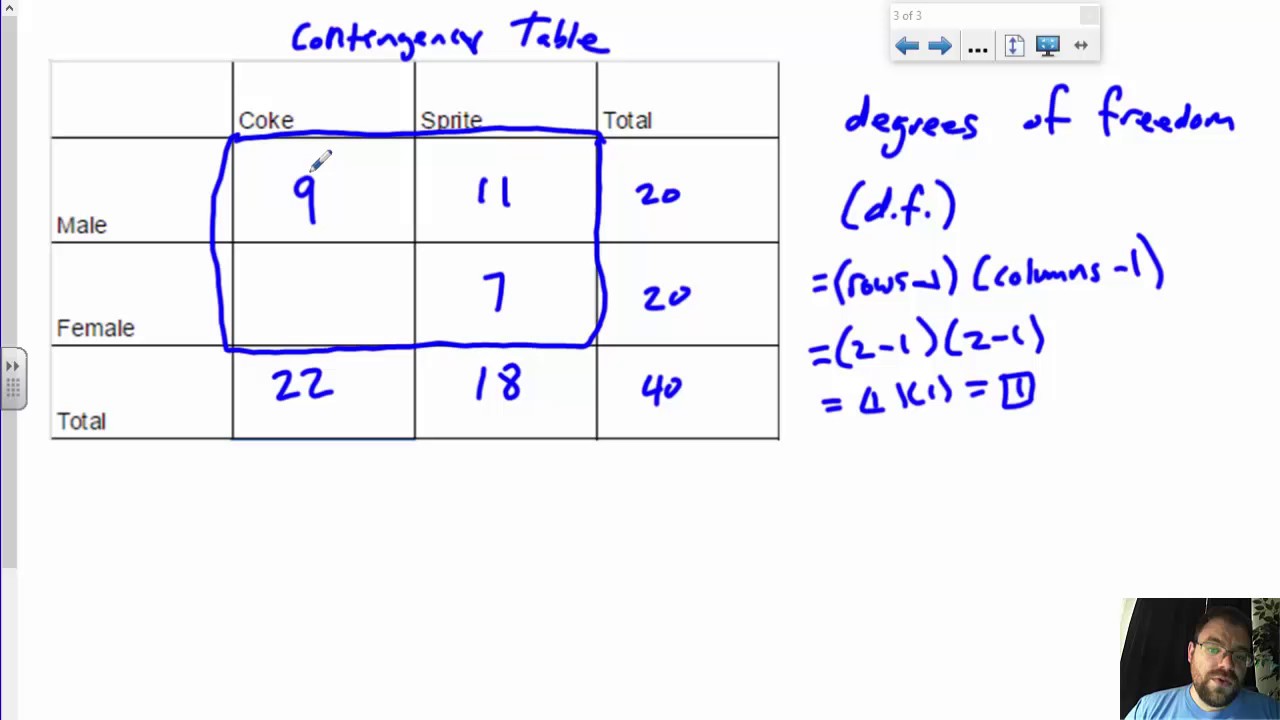
For a chi-square test, degrees of freedom are calculated based on the formula \(df = (r – 1)(c – 1)\), where \(r\) is the number of rows and \(c\) is the number of columns in your contingency table. This calculation reflects the independence of observations and informs how expected and observed frequencies differ, crucial in establishing the test statistic’s significance.
3. Can degrees of freedom change with sample size?
Yes, degrees of freedom can change with sample size. As sample size increases, the degrees of freedom typically increase, improving the power of statistical tests. Larger sample sizes allow for better estimations of population parameters, thus strengthening the analysis’ robustness. Understanding the relationship between sample size and degrees of freedom allows researchers to design studies with sufficient power to detect effects.
4. What is the relationship between degrees of freedom and variance?
The relationship between degrees of freedom and variance is intrinsic to statistical calculations. When estimating variance, the degrees of freedom affect how the sample variance is calculated. Specifically, using \(n – 1\) as the divisor in sample variance calculations adjusts for the loss of one degree of freedom due to estimating the mean, providing an unbiased estimate of the true population variance.
5. Why are degrees of freedom important in clinical trials?
Degrees of freedom are particularly important in clinical trials as they affect the analysis of treatment effects and variability. Proper calculation of degrees of freedom is vital for detecting significant treatment differences and understanding the precision of estimates, especially in small-sized clinical trials. Hence, careful management of degrees of freedom enhances the credibility and applicability of findings in clinical research.
6. How do degrees of freedom apply in regression analysis?
In regression analysis, degrees of freedom impact both the goodness-of-fit tests and the estimation of model parameters. Generally, for a regression model with \(k\) predictors and \(n\) observations, the degrees of freedom for residuals are calculated as \(df = n – k – 1\). This calculation is crucial for ensuring valid hypothesis testing in determining the relevance of predictors within the model.
7. What factors affect the degrees of freedom in ANOVA?
In ANOVA, several factors affect degrees of freedom, including the number of groups being compared and the total number of observations. The calculation is influenced notably by the structure of the experimental design, such as whether it’s a repeated measures design or a two-way ANOVA. Understanding these factors helps in correctly implementing the degrees of freedom formulas and interpreting ANOVA results effectively.